60% Fable cost cut by converting code to images and having the model OCR it
摘要
pxpipe 是本地代理,通过把 bulky context(如系统提示词、工具文档、旧历史记录)转为 PNG 图片,在请求离开机器前压缩,避免传输;图片 token 固定于像素维度,dense 内容(如代码、JSON)密度高至 ~3.1 chars/image-token vs text 的 ~1 char/token;Fable 5 demo 显示相同答案但费用从 $42.21 降至 $6.06,Opus demo 也实现相同结果;有损失性(exact recall 如 hex string 易出错,需保持 text),但 SWE-bench 等任务质量不变;提供 dashboard、events.jsonl 复现数据,并列出三类可压缩内容及可用库选项。
荐读理由
把 bulky system prompt/tool docs/older history 转成 compact PNG 经 HTTP proxy 注入 Fable 5 请求(localhost:47821),代码直接抄自 MIT 仓库,无需服务器
原文
pxpipe
Cut Claude Code's input tokens by rendering bulky context as images — the same system prompt, tool docs, and history, in a fraction of the tokens.
An image's token cost is fixed by its pixel dimensions, not by how much text is inside it. Dense content (code, JSON, tool output) packs ~3.1 chars per image-token vs ~1 char per text-token on real Claude Code traffic. pxpipe is a local proxy that exploits that gap: it rewrites the bulky parts of your request (system prompt, tool docs, older history) into compact PNGs before the request leaves your machine.
Savings are workload-dependent — pxpipe wins on token-dense content and leaves sparse/small requests untouched — so these are measured snapshots, not constants. The primary, durable result is input-token reduction: dense system prompts, tool docs, and history go in as compact images instead of text (the example above is ≈25k text tokens rendered as ≈2.7k image tokens), every request measured against its own count_tokens counterfactual. Dollars are downstream of that — at current Fable list prices the token cut lands as a ~59–70% lower end-to-end bill (~72–74% on compressed requests; full pricing math in the FAQ). But list prices can change tomorrow and the token count won't, so tokens — not dollars — are the number to watch. Reproduce both from ~/.pxpipe/events.jsonl.
This is what the model sees instead of text:
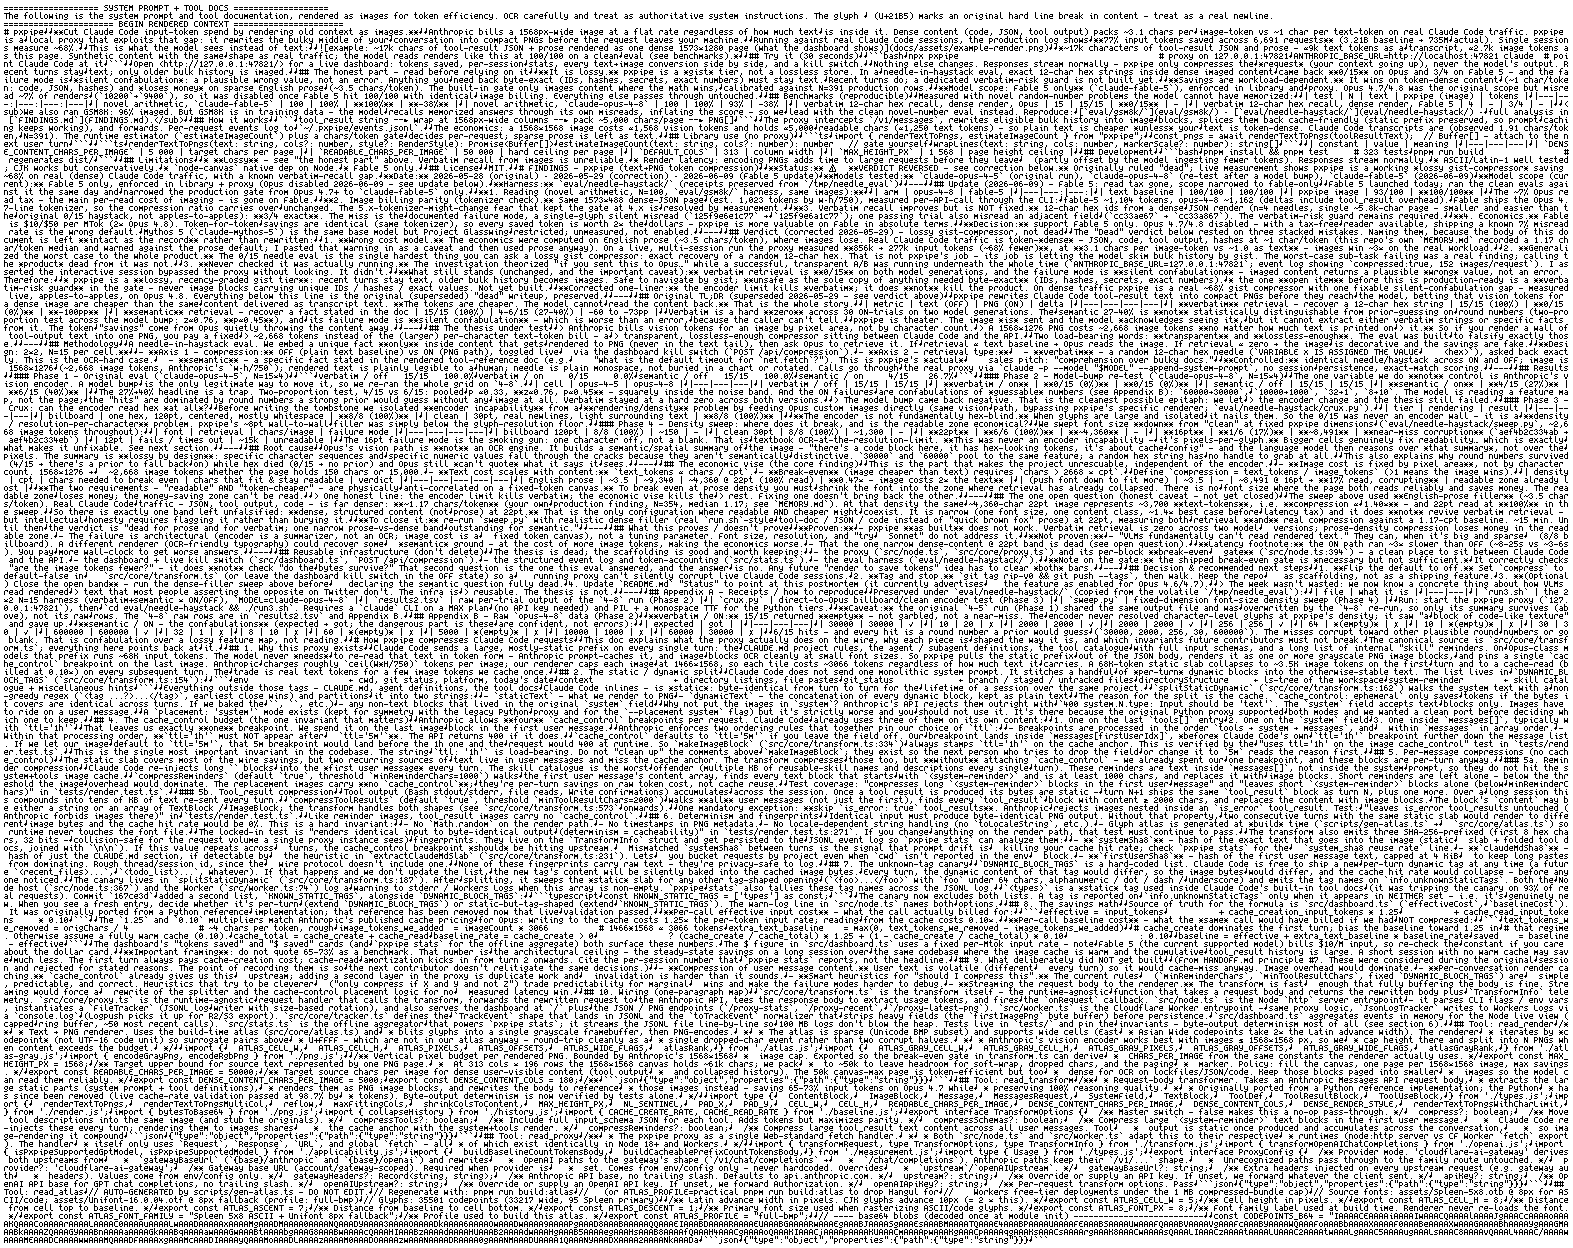
~48k characters of system prompt + tool docs (this repo's own README, FINDINGS, and source), ≈25k tokens as text, ≈2.7k image tokens as this page. Produced by the real transformRequest pipeline: whitespace-minified, reflowed into full rows with ↵ marking original newlines, OCR instruction banner co-rendered on top. The model reads renders like this at 100/100 on a clean eval (see benchmarks).
Demo
Fable 5 demo (the default, 100/100 reader):
Fable-AB-Demo.mp4
Both demos with both panes on Fable 5 (plain left, pxpipe right).
Fable reads what Opus can't. The imaged phrase-count that Opus refuses (see the Opus demo below): the pxpipe arm counts the exact token 10/10 across 39 imaged filler files (matches
grepground truth line-for-line) and gets the multi-step ledger arithmetic right (8037 → … → 15,021).Same answers, ~7× cheaper. Session totals after both demos: plain $42.21, context 96% full (964.5k/1M — one task away from forced compaction) vs pxpipe $6.06 with context to spare (73.5k/1M).
Honest caveat, visible in the clip: the pxpipe arm answered the count first and needed one follow-up nudge to also print the ledger balance in the requested one-line format; the plain arm followed the format on the first try. Legibility is solved on Fable — single-reply format compliance is the remaining rough edge.
Opus 4.8 demo (Opus disabled by default):
Opus-AB-Demo.mp4
Side-by-side — plain Claude (left) vs pxpipe (right), both on Opus 4.8 (opt-in; pxpipe is tuned for Fable — see the Fable clip above). Click the image to watch (Google Drive).
Demo 1 — fix a failing test suite: both pass; the dashboard shows pxpipe cut the request to a fraction of the tokens (real, server-measured context/token reduction).
Demo 2 — a big file-context (40 files, ~382k tokens) plus a math question and a "count this phrase" task: the math answer (a small text needle) reads on both. The phrase-count needs reading the imaged filler — so pxpipe-on-Opus can't read it and honestly surfaces that it won't fabricate a number (the documented lossy limit: exact values stay text). Plain, meanwhile, bogs down counting file-by-file.
Try it (30 seconds)
npx pxpipe-proxy                                  # proxy on 127.0.0.1:47821
ANTHROPIC_BASE_URL=http://localhost:47821 claude  # point Claude Code at it
Open http://127.0.0.1:47821/ for a live dashboard: tokens saved, per-session stats, every text→image conversion side by side, a global kill switch, and runtime model chips including GPT 5.6 and GPT 5.5.
Nothing else changes. Responses stream normally; pxpipe only compresses the request (your context going up), never the model's output. Recent turns stay text; the system prompt, tool docs, and older bulk history are imaged.
The honest part, read before relying on it
It is lossy. pxpipe is a gist tier, not a lossless store. In a needle-in-haystack eval, exact 12-char hex strings inside dense imaged content came back 0/15 on Opus and 13/15 on Fable 5, and the failure mode is silent confabulation: a plausible wrong value, not an error. Anything you need back byte-exact (IDs, hashes, secrets, exact numbers) must stay text. Recent turns do; a dedicated verbatim-risk guard is not built yet.
Exact-recall escape hatch. pxpipe only images Fable requests (PXPIPE_MODELS=claude-fable-5), so any subagent on a non-Fable model passes through as text. Route work that needs byte-exact values to one — globally with CLAUDE_CODE_SUBAGENT_MODEL=claude-sonnet-4-6, or per-agent with model: sonnet in the agent frontmatter. It reads from source (file/JSONL), not the imaged history. This covers exact-recall you route on purpose; it does not catch a silent misread you did not expect — that is the unbuilt guard above.
Does it break real work? Parity in what we measured: a 10-instance SWE-bench Lite pilot (the easy subset) resolved 10/10 on both arms, pxpipe ON at $27 vs OFF at $54 token-equivalent, and 19 SWE-bench Pro pairs (harder, long-horizon) resolved 14/19 ON vs 15/19 OFF at -60% per-request: verdicts agree on 18/19, and the single split (one ON fail) re-resolved 3/3 when replicated, i.e. run-to-run agentic variance, not compression. Small n, details and caveats below.
Savings are workload-dependent. It wins on token-dense content (~1 char/token: code, JSON, hashes) and loses money on sparse English prose (~3.5 chars/token). The built-in gate only images content where the math wins, calibrated against N=391 production rows.
Model scope: one PXPIPE_MODELS CSV controls which model bases get imaged across both families — default claude-fable-5,gpt-5.6 (GPT 5.5 is opt-in; it degrades on imaged context). Set PXPIPE_MODELS=off to disable imaging entirely, or use ~/.config/pxpipe/config.json with { "models": "off" } (or a list). For GPT, pxpipe keeps tool definitions in native JSON (only verbose schema prose moves into the image) so tool-calling stays reliable; unlike the Claude path, the GPT path does not add or depend on Anthropic cache_control prompt-cache markers. The dashboard chips can flip any model live without changing client configs. Opus 4.7/4.8 was the original Claude scope but misread ~7% of renders (10200→9400), so it was turned off by default once Fable 5 hit 100/100 with identical image billing — opt it back in at your own risk via PXPIPE_MODELS or the dashboard chips. Everything else passes through untouched.
Benchmarks (reproducible)
Measured with novel random-number problems the model cannot have memorized:
| test | N | text | pxpipe (image) | tokens |
|---|---|---|---|---|
novel arithmetic, claude-fable-5 |
100 | 100% | 100% | −38% |
novel arithmetic, claude-opus-4-8 |
100 | 100% | 93% | −38% |
| gist recall A/B (decisions, values, paths, names, negations; with distractors; 15k-45k char sessions), Fable 5 | 98/arm | 98/98 | 98/98 | - |
| state tracking (value mutated 3x, final/first/count), Fable 5 | 18/arm | 18/18 | 18/18 | - |
| confabulation on never-stated facts (lower is better), Fable 5 | 16/arm | 0/16 | 0/16 | - |
| verbatim 12-char hex recall, dense render, Opus | 15 | 15/15 | 0/15 | - |
| verbatim 12-char hex recall, dense render, Fable 5 | 15 | - | 13/15 | - |
SWE-bench Lite pilot (end-to-end task quality)
10 SWE-bench Lite instances, Claude Code + Fable 5, paired runs through pxpipe ON vs OFF, graded with the official swebench Docker harness:
| pxpipe ON | OFF | |
|---|---|---|
| resolved | 10/10 | 10/10 |
| request size vs own uncompressed body | −65% | ±0 |
The −65% is per-request (count_tokens probe of each body before compression), so it has no turn-count confound. n=10/arm, Lite skews easy. Run totals, receipts, caveats: eval/swe-bench/.
SWE-bench Pro bench (harder, long-horizon)
19 completed pairs across two runs (2 dropped: checkout failed both arms), same setup, official SWE-bench_Pro-os Docker harness:
| pxpipe ON | OFF | |
|---|---|---|
| resolved | 14/19 | 15/19 |
| request size vs own uncompressed body | −60% | ±0 |
Verdicts agree on 18/19 (three instances failed both arms, one with byte-identical patches across arms). The single split (navidrome, ON fail) was replicated 3x on the ON arm: all three runs produced an identical patch and resolved, so the original loss was run-to-run agentic variance, not compression. Receipts: eval/swe-bench-pro/.
We also ran GSM8K: 96% imaged. But GSM8K is in training data, so the model recalls memorized answers through its own misreads, inflating the score, so we lead with the clean novel-number eval instead. Reproduce: eval/gsm8k/ · eval/needle-haystack/ · eval/gist-recall/ · full analysis in FINDINGS.md.
FAQ
Is the headline end-to-end, or only on the requests you touched? End-to-end, the whole bill. Most compression tools report savings only on the input slice they touched, which flatters the number. The end-to-end denominator is every production request: the small ones pxpipe correctly left untouched, all cache writes and reads, and all output tokens (which the proxy never compresses). On a 13,709-request snapshot that was 59% ($100 → ~$41); a later 8,904-compressed-request trace measured ~70%. Compressed-only runs higher (~72–74%) and is quoted separately, never as the headline. The exact figure is workload-dependent — reproduce it on your own log.
How is the math measured? Both sides of the same request, at the same moment. For every /v1/messages POST the proxy fires a free count_tokens probe on the original uncompressed body (the counterfactual) in parallel with the real forward, and reads Anthropic's actually-billed usage block off the response. Both land in the same row of ~/.pxpipe/events.jsonl, so there is no turn-count or run-to-run confound. Dollar conversion uses Fable 5 list ratios: input ×1.0, cache write ×1.25, cache read ×0.1, output ×5. Cache pricing is applied identically to both sides, so the caching discount cancels and cannot be double-counted as "savings". Re-derive it yourself from the events log: the formula and field names are documented in src/core/baseline.ts.
What does it actually compress? Three kinds of input blocks, each behind a profitability gate:
large
tool_resultbodies (file reads, command output, logs) above ~6k chars of token-dense contentolder collapsed history: turns behind the live tail get re-rendered as image pages, recent turns always stay text
the static system prompt + tool docs slab
Everything else passes through byte-identical: your messages, recent turns, the model's output (it is the response, the proxy never touches it), sparse prose, and anything too small to win. Non-Fable models pass through entirely.
Has it ever failed for real, outside the benchmarks? Yes, once in weeks of daily use: the model recalled a person's name from imaged chat history and got it confidently wrong. No error, just a plausible wrong name. That is the documented failure mode: exact strings in imaged content are not byte-safe. Coding sessions tolerate this because the agent re-reads files before editing; pure chat recall has no such check.
How it works
tool_result string ──► wrap at 1928px-wide columns ──► pack ~92,000 chars/page ──► PNG[]
The proxy intercepts /v1/messages, rewrites eligible bulk history into image blocks, splices them back cache-friendly (static prefix preserved, so prompt caching keeps working), and forwards. Per-request events log to ~/.pxpipe/events.jsonl.
The economics: a 1928×1928 image costs ≈4,761 vision tokens and holds up to ≈92,000 chars (≈48,000 text tokens at the observed density), so plain text is cheaper only when it runs denser than ~19 chars/token. Claude Code transcripts are far below that (observed 1.91 chars/token, N=391). The runtime estimator (estimateImageCount) plus a chars/token gate decides per-request; sparse prose is left as text.
Library use (no proxy)
Same engine, no proxy. Render text → PNGs, or run the full cache-safe transform:
import { renderTextToPngs, transformAnthropicMessages } from "pxpipe";

const imgs = await renderTextToPngs(toolResultText);            // RenderedImage[]
const { body, applied, info } = await transformAnthropicMessages({
  body: requestBytes,
  model: "claude-fable-5",
});
options.keepSharp(block) pins blocks as text (override the heuristic for IDs, hashes, paths); options.emitRecoverable returns the originals of imaged blocks so a stateful caller can recover them — the two halves of the fidelity contract for the lossy limitation below. Runtime is pure-JS (Node and edge/Workers); @napi-rs/canvas is build-time only. Full API, types, and constants: src/core/index.ts.
Development
pnpm install && pnpm test     # 376 tests
pnpm run build                # regenerates dist/
Limitations
Lossy: see "the honest part" above. Verbatim recall from images is unreliable.
Render latency: encoding PNGs adds time to large requests before they leave (partly offset by the model ingesting fewer tokens). Responses stream normally.
ASCII/Latin-1 well tested; CJK works but conservatively.
Runtime is pure-JS — runs on Node and edge/Workers.
@napi-rs/canvasis a build-time-only dev dep (regenerating the glyph atlas), not a runtime dep.Fable 5 only.
Roadmap
Everything above is measured. Everything here is not. These are hypotheses, not claims; they ship as numbers with an n or they get cut.
Sharper glyphs. The 13/15 verbatim gap is partly font legibility, not just the model. A per-char confusion matrix across render styles is paused mid-run (
eval/glyph-matrix/); if a zero-cost style lowers read error, the gate compresses harder at the same fidelity.Effective context. Dense text carries at ~3x fewer tokens as images. If that holds in the live window and not just the bill, 1M tokens holds ~2x the real content. Open question: can a task needing ~2M raw context run inside Fable's 1M once the bulk is imaged?
Less active text, sharper model. Long contexts degrade reasoning as they fill. Imaging old bulk shrinks what the model actively reads while keeping it reachable. Hypothesis: same information, smaller active context, better long-task accuracy.
One bet: longer effective context and a sharper model on long tasks, from the same Fable 5. Numbers or retraction, no hype between.
License
MIT.
这条对你有帮助吗?