We scaled PgBouncer to 4x throughput
摘要
正文解释 PgBouncer 是单线程,每进程仅用 1 个 CPU 核心,16 vCPU 机器会闲置;ClickHouse Managed Postgres 部署多进程 PgBouncer 舰队(fleet),每进程绑定同一端口启用 SO_REUSEPORT,内核负载均衡客户端连接;通过 peering 实现查询取消请求跨进程转发;连接池在事务模式下按进程数分割预算,避免超额占用 Postgres;实测中,使用 16 vCPU c7i.4xlarge 实例,单进程 PgBouncer 峰值约 87k TPS(CPU 占用仅 ~97%),舰队峰值约 336k TPS(CPU 占用 ~8 核),在 256 客户端负载下舰队吞吐是单进程的 4 倍,实例整体 CPU 利用率从 ~16% 升至 ~60%;并给出客户端单 TPS 和 CPU 占用对比数据表。
荐读理由
PgBouncer 单线程特性导致大核闲置,fleet 用 reuseport + 进程间 peering 实现跨进程 cancel 转发和连接预算分片,能把 16 vCPU 机器 CPU 利用率从 10% 推到 50%+,吞吐从 87k 升至 336k TPS,照样直接抄到自家 AI 项目里
原文
PgBouncer is single-threaded. A single process uses one CPU core, no matter how many the machine has. On a 16-vCPU box that means one core does all the connection pooling while the other fifteen sit idle, and the pooler starts capping throughput long before Postgres runs out of room.
In ClickHouse Managed Postgres we run a fleet of PgBouncer processes, sized proportional to the available cores.
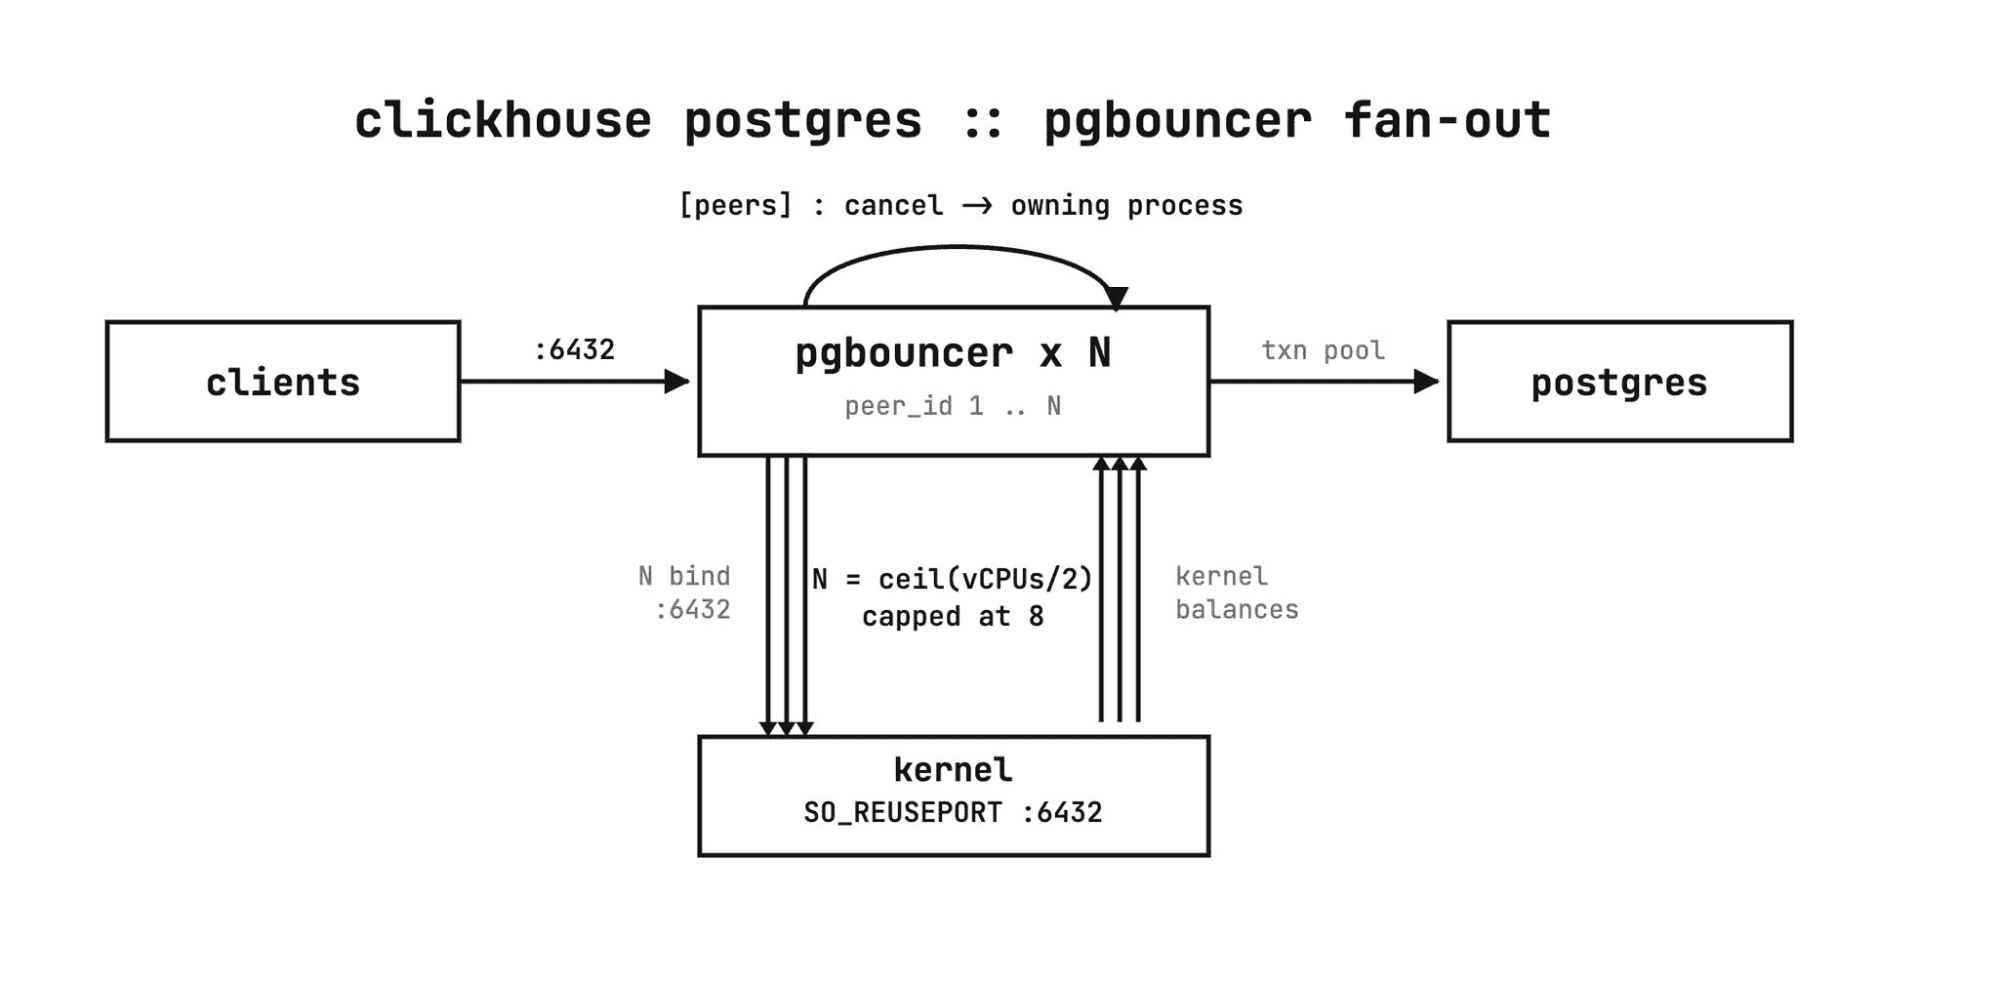
Every process in the fleet binds the same port with so_reuseport enabled. The kernel load-balances incoming connections across the processes, so clients still connect to a single endpoint and never know there is more than one PgBouncer behind it. This is the mechanism PgBouncer's own docs point to for using more than one core: it is single-threaded per process, and so_reuseport is how you put every core to work.
The catch: query cancellation
A Postgres cancel request arrives on a brand-new connection carrying a cancel key, separate from the connection running the query. With so_reuseport, the kernel is free to hand that new connection to a different process than the one holding the session. The cancel lands on a process that has never heard of the query, and nothing happens.
Peering fixes this. The processes are aware of one another, so a cancel that lands on the wrong process is forwarded to the one that actually owns the session. Cancellation works across the whole fleet, even though any given request can arrive anywhere.
Pooling runs in transaction mode, so a server connection is returned to the pool the moment a transaction commits. And the connection budget is split across the fleet: max_client_conn and max_db_connections are divided by the number of processes, so the fleet as a whole never oversubscribes Postgres.
Seeing it on real hardware
We ran both configurations on identical AWS EC2 instances: a 16-vCPU c7i.4xlarge for the pooler, a separate box for Postgres, and a third driving load with pgbench in select-only, transaction-pooled mode. One pooler box ran a single PgBouncer process; the other ran a fleet of 16. Same instance type, same Postgres, same workload. The only variable is one process versus sixteen.
We ramped client connections from 8 to 256 and measured throughput and how much of the 16-core box each pooler actually used.
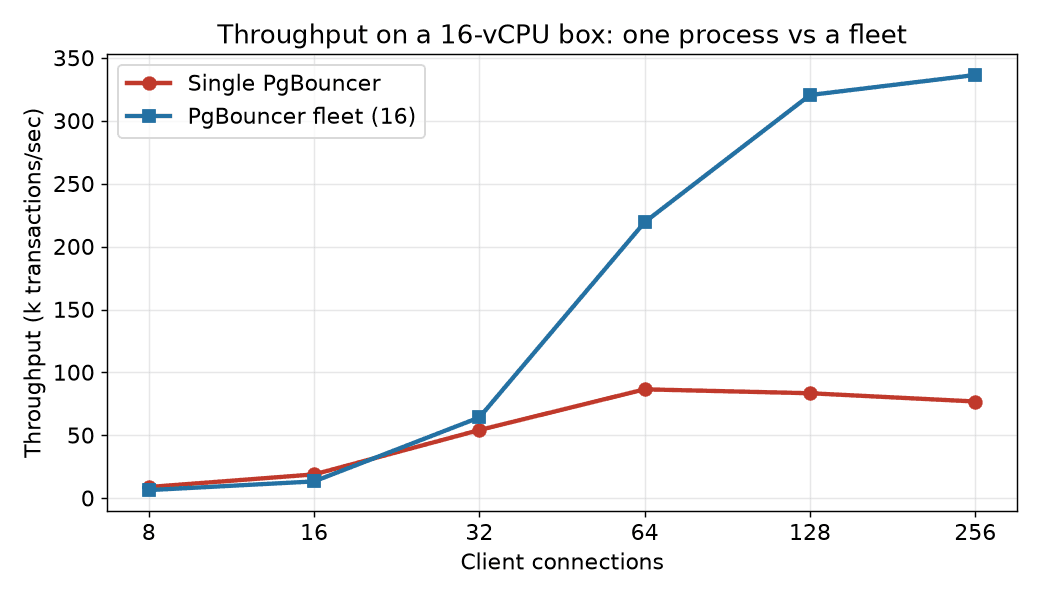
The single process peaks around 87k transactions/sec and then gets worse under more load, sliding to 77k at 256 clients as everything contends for one core. The fleet keeps climbing to roughly 336k transactions/sec, about 4x, because it has more cores to climb into.
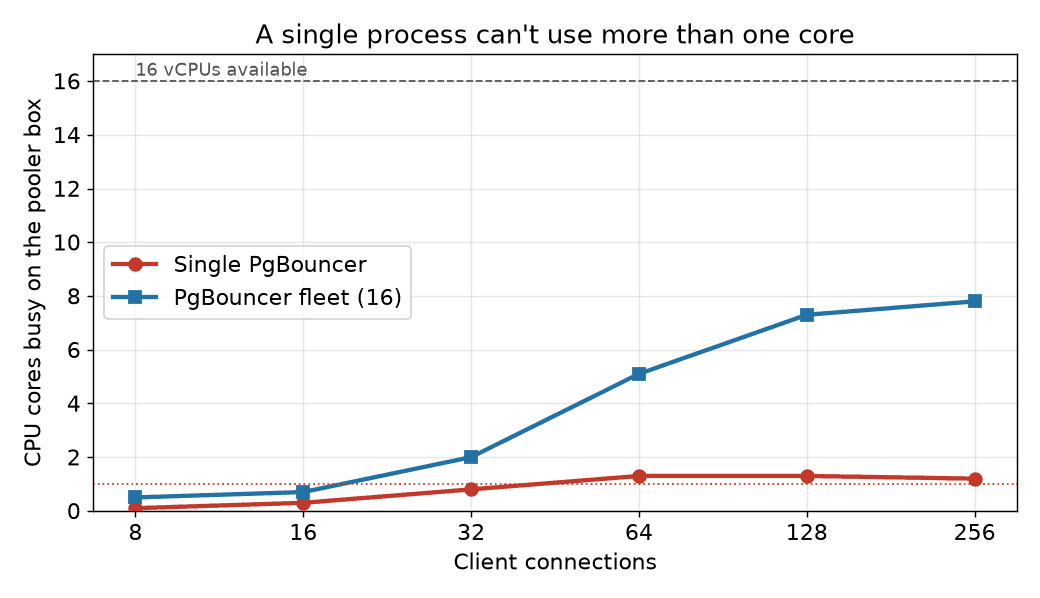
The single process never gets past about one core of work: under load, pidstat shows the PgBouncer process pinned at ~97% CPU, a full core, while the 16-vCPU box as a whole stays under 10% utilized. The fleet spreads across the machine, reaching roughly 8 cores busy, and it still had headroom when Postgres and the load generator became the limit.
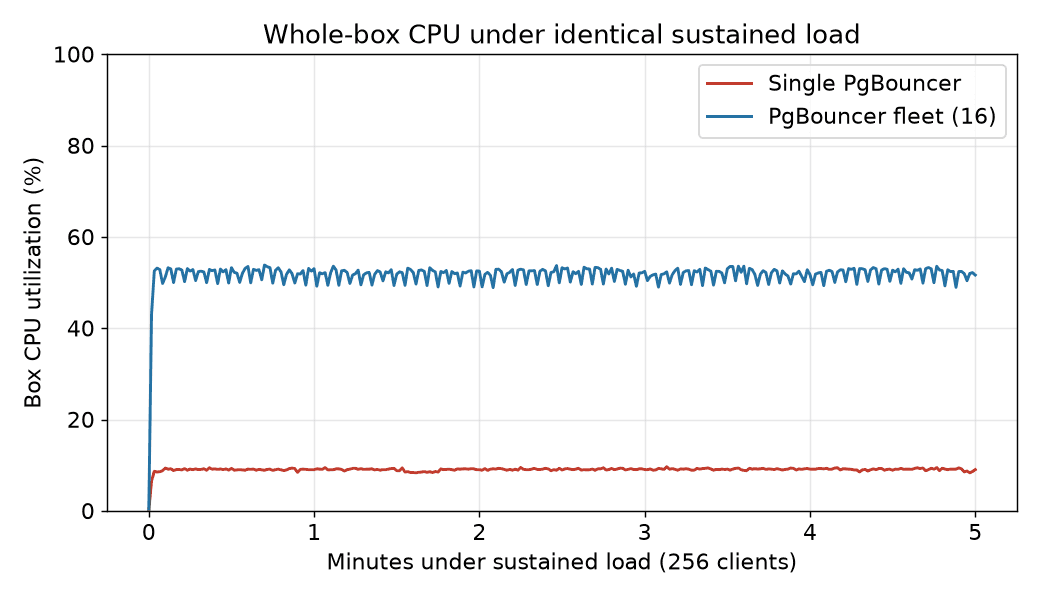
Hold 256 clients steady against each box: the single-process box runs near 9% CPU for the entire run while the fleet holds around 52%. Same instance type, same Postgres, same workload. One configuration leaves the machine idle, the other puts it to work.
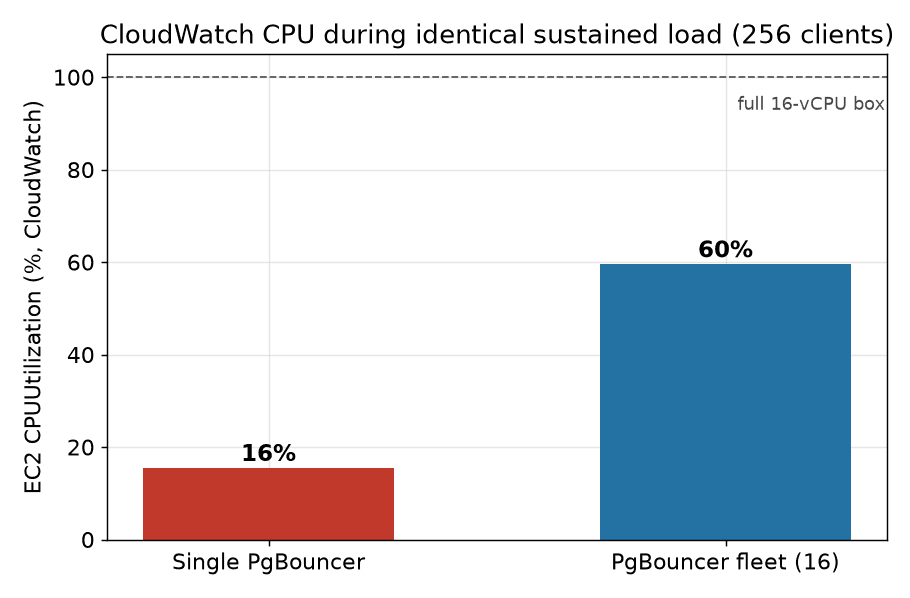
EC2's own CloudWatch metric says the same thing from outside the guest: during the load the single-process instance averages about 16% CPUUtilization, the fleet about 60%. CloudWatch reads a little higher than the in-guest number, but the same gap holds: on a box you're paying 16 vCPUs for, a single PgBouncer leaves almost all of it on the floor.
The connection ceiling behaves the same way. A single process enforces max_client_conn on its own, and once you cross it, new clients are turned away:
1FATAL: no more connections allowed (max_client_conn)
Splitting the budget across the fleet is what lets you raise the aggregate ceiling while keeping each process, and Postgres, within safe limits.
| Clients | Single TPS | Single box CPU | Fleet TPS | Fleet box CPU |
|---|---|---|---|---|
| 8 | 8,910 | 0.8% | 6,450 | 2.9% |
| 32 | 54,203 | 5.2% | 64,244 | 12.3% |
| 64 | 86,570 | 8.3% | 219,439 | 31.9% |
| 128 | 83,463 | 8.1% | 320,547 | 45.9% |
| 256 | 76,893 | 7.7% | 336,469 | 48.9% |
At a handful of connections the single process is actually fine, even a hair faster, since there's nothing to parallelize and the fleet's connections are spread thin. The gap opens exactly where it matters: under real concurrency, where one core becomes the wall.
The takeaway
A single PgBouncer is a fine default until the pooler, not Postgres, is what caps your throughput. Sizing a fleet to the cores, sharing one port with so_reuseport, and wiring the processes together with peering turns the pooler back into plumbing instead of a bottleneck.
Every ClickHouse Managed Postgres server ships with this setup by default. Provision a Postgres and see it in action.
Try Postgres managed by ClickHouse
ClickHouse + Postgres has become the unified data stack for applications that scale. With Managed Postgres now available in ClickHouse Cloud, this stack is a day-1 decision.
这条对你有帮助吗?