How Long Does That Response Take... For Real?
摘要
文章讨论 memcached 的内部响应时间指标为何具有误导性:由于请求处理通常在毫秒以内完成,真正影响延迟的往往是 OS 网络缓冲区排队、负载分布和客户端处理时间,而这些都不会被服务器端计时捕捉。即使在高负载下,单个 GET 处理时间看似不变,但客户端感知到的延迟可能显著上升,因为请求在进入 memcached 之前已经排队。作者指出不同操作(如 SET)可能受影响,但 GET 仍可能主要卡在网络队列中,因此单一内部指标无法反映系统真实健康状况。文章建议以客户端采样的端到端响应时间为主,并结合 CPU、网络与本地探测数据进行关联分析,以更准确定位瓶颈来源。
荐读理由
建议在客户端采样记录全链路响应时间,包括排队等待与网络缓冲期,然后用本地连接测试脚本同服检测,与客户端时长联动判断是 daemon 负载还是网络瓶颈。
原文

How Long Does That Response Take... For Real? - Dormando (May 8, 2026)
Introduction
Why does memcached not have response time metrics? This is a frustrating question with an unsatisfying answer: the metrics would be misleading.
Kicking off with a spoiler: memcached response time is best measured by sampling response times from the client. This takes the entire round trip into consideration and gives the most actionable information, most of the time. The rest of this post is an exploration of why.
To Measure Time, You Have to Start Somewhere
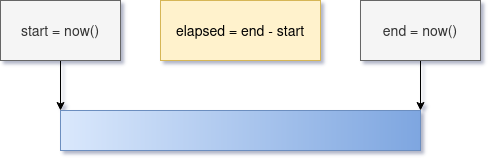
What is the goal of measuring response time? We want it to inform us of the health of the system and its upstream impact. We want to drop the times in a graph and throw an alert if it gets out of whack, or correlate it with other data if a service is impacted. This seems like a silly question but it is important to ensure a metric actually answers what we think it does.
In most common services measuring response time works the same way: A request arrives at the service, and it notes the time when it begins to process it. When it is ready to ship the response back to the client, it checks the time again and compares it with the start. Easy, right?
Finding the Start for a Web API Call
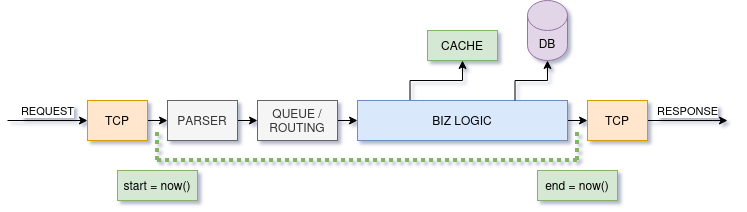
A typical application is processing a request for much longer than a millisecond. It might compete for resources, make sub-requests to other services, read data from disk, etc. An application has many dependencies that influence how long it takes to generate a response.
A service reads a request from the network, notes the time it was received, then enqueues it or ships it off to other threads to process. In a Go app, for example, many lightweight threads are starting and stopping as a request moves through the program.
Finding the Start for a Memcached Call

That start time is key here. Memcached is unlike most infrastructure software: requests are typically processed in less than a millisecond. The request load does not usually change this number! This seems absurd, because we can observe response times much higher than this from a client when under load.
When we measure time is critical. Memcached processes requests as soon as they are read off of a network socket. Responses are very quickly generated. The first chance it gets to measure time is close to the end.
What Influences Total Time?
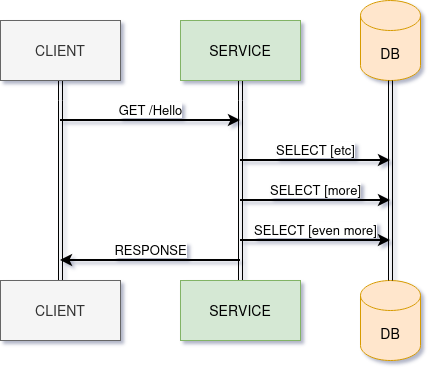
A large image will take longer to process than a smaller one. If loading a product category for a store, more items will take longer to process. It may make many database calls (or calls to memcached!) to decorate products with size, price, and inventory level.
What happens if a server gets overloaded? Does it keep reading requests from the network, creating a queue internally, then process them as it can? Does it refuse further requests and let a load balancer redirect to another server?
The thread model for memcached is one worker thread per CPU core. When requests are sent to memcached one thread gets notified that sockets are ready to read. It then iterates through the “ready” sockets one at a time, reading data from the network. Worker threads operate independently from each other, only sharing cache data.
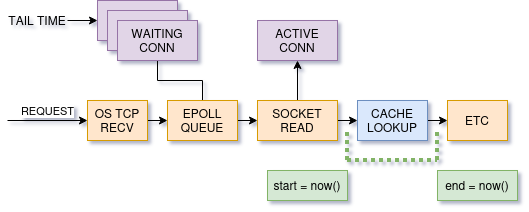
If a worker thread has a lot of sockets to read from at the same time, the last socket in the list will have the worst response time. Sadly we cannot measure the time a request waits in a queue, only the time spent processing requests. A GET request will take the same amount of time regardless of how busy the server is.
What happens when memcached is overloaded? Requests will sit in OS network buffers waiting to be read, without any way of kicking off the stop watch. Now we fail to answer to our original goal: internal response times do not tell us much. Best case we are wasting CPU tracking the measurement.
How Measuring Time Can Mislead
I did lie a bit: internal response time can vary. The problem with response time is it does not tell us where to look.
Misconfigured? More worker threads than CPU cores? Too many other programs running?
If a client sends 100 requests at the same time, each individual request will take a tenth of a millisecond, but the client may only see responses after all 100 are processed.
Huge responses take the same amount of time for memcached to process as small ones. A client will take a lot longer to read and parse a megabyte than a kilobyte.
SET requests scale poorly in memcached. A very high SET load can cause requests to take measurably longer… but only SET commands! GETs are still stuck in a network queue.
We use SSD storage when extstore is enabled, which can slow down. This is legitimate and we should measure specifically time waiting on disk. This gives us one number that says “The disk is slow”, rather than something vague.
Measure from the Client
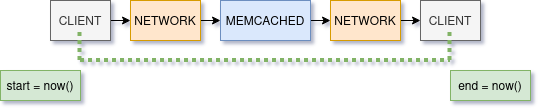
We recommend looking at the total response time from a client. With this you know for sure what the impact is to your service. From there you can correlate with other metrics. If the response time is high, is memcached’s CPU usage also high? Is the network dropping packets? Is someone bulk-loading a million items per second?
It is a lot easier, for me at least, to correlate top down than bottom up. If memcached’s internal response time is high, we have no idea what the upstream impact actually is.
While I would love to link to a utility to do this for you, there is a wide variety of telemetry setups and it is hard to give an easy answer. Hopefully this is easy for your system; a quick sampled telemetry will tell you everything you need.
Our documentation does have a utility to experiment with: a connection tester script is discussed here.
The built in memcached proxy can also measure sampled time with its logging system. Helpful if you run proxies locally on application hosts, acting as a client.
It is important for a metric to have a good, useful signal. Especially for a core metric that we look at first when things go wrong, or as a predictor for needing to scale or reduce capacity. We carefully examined the basics and found a simple and impactful change.
Extra Points: Local Measurements
Being thorough, let us combine client measurements with a program running on the same server as memcached. This program connects and makes a request either once or a few times per second. The measurement is useful because it is external to memcached, and must wait in the same OS queues as any other request. The connection tester listed above is a great example to start with.
We can then correlate this with client timing. If times rise together, daemon load is most likely high. If they diverge, the network is more likely the bottleneck.
This trick gives you a great starting point to pick a road to troubleshoot.
Conclusion
In this post we saw how the consistently lightweight processing times of memcached can lead to a common metric being misleading or useless. We ensure that the response time metrics gathered actually correlate to the health of the system and demonstrate the impact to upstream users. Hopefully this clears up confusion as to why we do not provide these metrics from the server!
This page is maintained by Dormando. Logo/Banner images are Copyright (c) 2009-2018 Dormando, and may not be used without permission. Layout forked from Scott Chacon and Petr Baudis' git-scm.com
Please contact the mailing list with suggestions and comments.
这条对你有帮助吗?